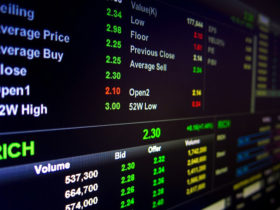
Pure oscillator traders are missing out on one of the most interesting and useful tool on the market. The NYSE Ticks can show you a world of information about the number of stocks that are increasing vs stocks that are declining. If you understand how to use this valuable information you may feel like you have hit the mother lode of trading information. The NYSE Ticks (TradeStation symbol $TICK) are a compilation of the if the markets buying and selling activity, but you must develop some useful filters for sorting out this information and applying it to your trading style.
If you have read any of the articles I have written, you know that I working very hard at staying out of trades that originate in a loose term called "market noise." I like to trade break-outs and break-downs, and avoid initiating trades in the market noise, which is generally the normal backing and filling action the market offers. To be sure, market noise dominates the daily market, nearly 70% of the price action is market noise, and it takes patience and self-discipline to stay out of the market noise.
For me, any action that occurs between +450 and -450 on the $TICK is market noise and does not warrant my attention. I should point out the the NYSE Ticks are not dissimilar from an oscillator to read, that is to say there are threshold points at which the market breaks out of the market noise, and I start paying close attention. Most traders who are not familiar with the $TICK charts should have little problem interpreting the information, but have to have a handle on the information before we can truly trade. At what levels should I enter a trade? At what levels should I exit a trade?
If you are in a trade and the $TICK starts to turn against you some, say up to +250 on a short trade, are you going to be ready to bail? Remember what I said in paragraph 3? Anything between +450 and -450 is market noise, and a +250 reading on the NYSE Ticks is just that, market noise. Even in a breakdown, there is going to be backing and filling and these two factors are a simple part of trading.
On the other hand, if the NYSE Ticks hit +600, I am going to notice and prepare a plan of action. The $TICK is one of two indicators I have an alarm set, and that alarm will sound when the market bashes into +600 or -600. The $TICK is one of the few indicators I have absolute rules that are not debated in my mind. That is to say, when the market pierces the +800 or -800 and I am in a trade in the opposite direction, I exit immediately. No thinking. No rationalizing, I get out. Period. Why? Readings of +800 or -800 are extreme, and if the action hasn’t been reflected in the price action, it will be soon. Exit now. Isn’t that a handy way to exit a trade that isn’t working properly?
I really like to fade heavy movement in one direction. What does that mean? If the ticks reach +1000 or -1000 I am looking to take a trade in the opposite direction. I have a set of criterion I use to enter the trade which are fairly complicated and a little advanced for the scope of this article, but suffice it to say that when the market gets hit with the heavy buying/selling pressure it takes to reach these levels, you can look for the market to consider reversing field.
While many traders confine themselves to the realm of oscillators the NYSE Tick is some real time information that is not reinterpreted through a mathematical formula, or hypothetical like pivots or the Fibonacci sequence. This is real data that will give you a glimpse into the markets, and few traders avail themselves the opportunity to do so. The NYSE Ticks are always a part of my trading, and sometimes the most reliable. Remember how to interpret the data displayed and you can profit from $TICK, and not rely upon a perennially lagging indicator to make your trading decisions. The NYSE Tick will give you an understanding of you chart that may have been lacking.
In summary, the $TICK provide a wealth of knowledge about the aggregate stocks rising vs the aggregate stocks falling, and we have to interpret that readings of the indicator to make sense of them. Market price action between +450 and -450 is noise, and should be ignored, regardless of the implications you think you might see. If I am in a trade and the market reaches +800 or -800 and I am in a trade opposite those numbers, I immediately exit. No thinking about it. Anytime the ticks registers +1000 or -1000 the market is ripe to change direction, as this kind of buying/selling pressure is unlikely to continue. And finally, NYSE Ticks indicator is unfiltered market information, no formulas like the oscillators, no hypotheticals like pivots or the Fibonacci sequence, the NYSE Ticks is the market as it is, and you can profit by learning this indicator.


